
Local Weather Resources
Local Conditions and Forecast
See the local conditions and forecast.
EMU Webcam and Traffic
Get high definition webcam views of EMU and traffic surrounding Ypsilanti, MI.
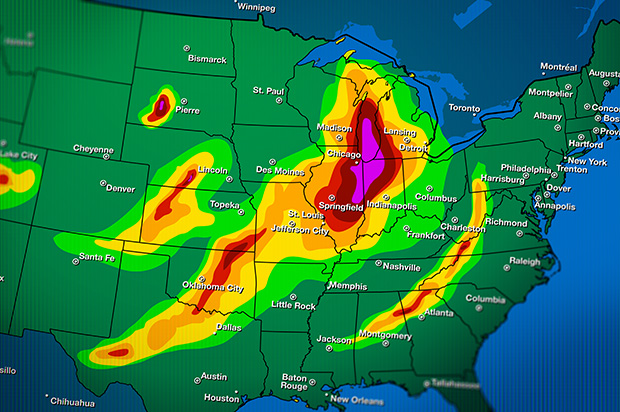
Live Radar
View the local, live radar.
140 Strong Hall
Eastern Michigan University
Ypsilanti, Michigan 48197
734.487.0218
![]()
The Eastern Michigan University (EMU) weather program supports students in the environmental science, earth science, earth science secondary education, and geography programs. Students can start learning about forecasting weather including severe weather to satisfy their general education requirements. Students have used this to explore a career interest in broadcast meteorology or weather forecasting. Students can continue on to more traditional weather survey and climate change courses that serve the earth and environmental science programs. Students can use these degree programs to continue on to a meteorology or climatology graduate program and compete for graduate assistantships that provide paid tuition, fees, and a stipend. Students can also use the general education experience at EMU with proper advising to complete their four-year meteorology degree program elsewhere starting in their Junior year. If you are interested in learning about weather forecasting, please consider taking ESSC 101 Introduction to Weather and Forecasting at Eastern Michigan University. The course (both lecture and lab) is offered online and face-to-face during fall and winter semesters. You can also purchase Weather and Climate Forecasting: The Scientific Method in Action, written by the instructor, Professor Thomas Kovacs, from Kendall Hunt Publishing.
This section provides real-world applications of freely available weather data linked in the weather analysis section below to key concepts in the textbook, "Weather and Climate Forecasting: The Scientific Method in Action (Kendall Hunt)". Designed for both instructors and weather enthusiasts, each example shows how weather analysis websites can be used and connects textbook material and weather concepts, with appropriate chapters, to these current data sources. Instructors can use these examples to enhance lecture topics, build lab activities, or simply explore weather science in action. Weather enthusiasts can see examples of how various sources of data such as weather maps, radar, satellites images, etc. can be applied to ordinary and severe weather events.
On April 2, 2025, a widespread severe weather outbreak resulted in 114 confirmed tornadoes stretching from Arkansas and Missouri to the southern Great Lakes. This event offers a valuable example of how real-time weather forecasting tools align with textbook concepts to assess and predict summer hazardous conditions.
To analyze this outbreak using linked (in green) data with current data available under the weather analysis section, see below:
From March 28-30, 2025, a severe ice storm affected northern Michigan with up to 2 inches of ice accumulation. For reference an ice storm warning is issued for damaging ice storms of at least 0.25 inches of ice accumulation. This event offers a valuable example of how real-time weather forecasting tools align with textbook concepts to assess and predict winter hazardous conditions.
To analyze this outbreak using linked (in green) data with current data available under the weather analysis section, see below:
Forecasters and weather students analyze various weather maps, radar and satellite images, weather models and more. These are more data dense than viewed on public media such as TV and phone apps. Use the drop down menus to access publicly available weather data used by weather forecasters.
Access past weather map, precipitation, and temperature data.
Access Great Lake surface temperature and ice cover and US river flood stage.
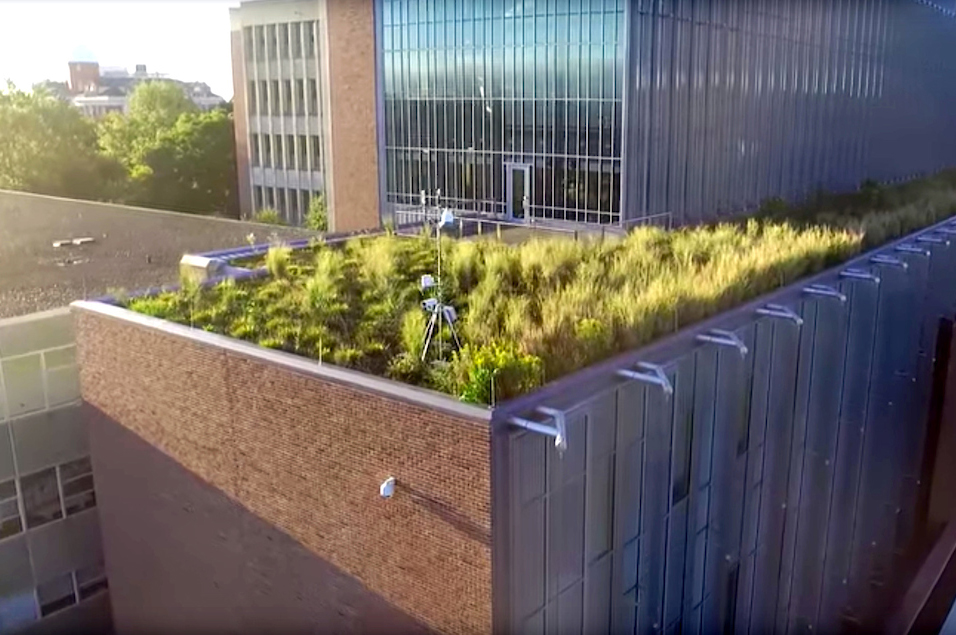
Access current and archived data from EMU's weather station on the roof of Mark Jefferson Science Complex.
National Weather Service Forecast Office for Detroit/Pontiac
Access surface-based U.S. Doppler radar images to see precipitating weather systems and their movement.
Access satellite images of the atmosphere including visible, infrared, and water vapor images. More functionality with images and loops are available at each location.
Access weather balloon data plotted on a special skew T diagram that allows analysis of precipitation type, air quality, and severe thunderstorm potential.
Access data from the network of weather balloons placed on weather maps of decreasing pressures (and therefore increasing altitudes) to get a cross-section of the atmosphere.
Access data from various weather models from rapidly updating short-term regional weather models to long-term global weather models. The links below takes you to one weather model output selection page for each model. Go to the Model Analysis and Guidance page for more options.
Access various long-range and hazardous weather forecast outlooks.
Go to the Weatherbug site.
Catch a glimpse of how meteorologists forecast the weather and how accurate these forecasts are. Take ESSC 101 at EMU to learn much more.
See how waves from the Tonga Volcanic eruption moved through the global atmosphere and briefly lifted fog in Seattle, WA.
See a cool lightning picture from October 2023 in southeast Michigan. This lightning went from cloud-to-air (not to the ground).
See a moon halo from November 5, 2022 in Tecumseh, MI. Halos around moon and sun can predict precipitation within the next 24 hours.
See the local conditions and forecast.
Get high definition webcam views of EMU and traffic surrounding Ypsilanti, MI.
View the local, live radar.